Spot and Stop Patient Leakage with Exclusive EMS Transport Insights
Use EMS origin-to-destination patterns, refferal visibility, and operational benchmarks to understand where patients are going—and what it means for throughput, service lines, and market share
See market share signals earlier with EMS transport context
See demand sooner: Use near-real-time transport signals to anticipate arrivals and likely acuity so you can optimize staffing and capacity.
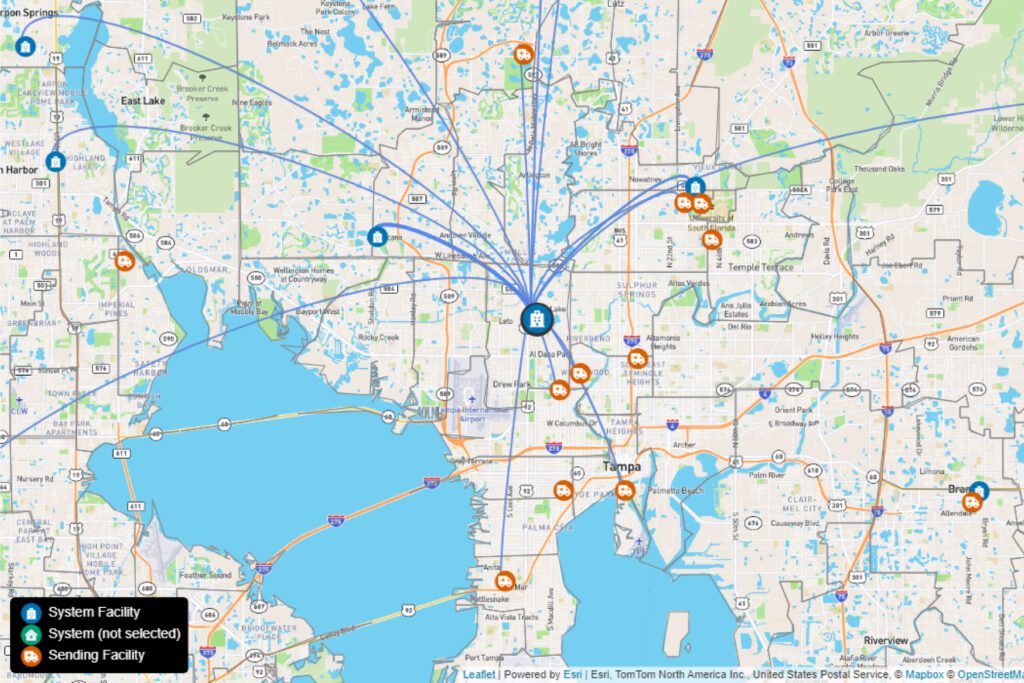
Understand your EMS-transport market share and referrals: Origin→destination views show where transported patients start and which facilities receive them—inside and outside your network.
Spot potential network leakage: See where and why EMS-transported patients go outside your system to prioritize outreach and improve your protocols.
Oversee interfacility transfers (IFT): Track sending/receiving flows and timing metrics to pinpoint delays and bottlenecks.
Add prehospital clinical context to handoffs: See assessments, treatments, and time intervals from ePCRs to enable earlier prenotification, cleaner handoffs, and consistent pathway reviews.
Referral leakage and offload performance are connected signals
When EMS-transported patients are choosing other destinations, it often shows up alongside operational friction—like arrival surges, longer offload times, and inconsistent throughput.
The interactive benchmarks below show what “normal” looks like nationally for offload time and common EMS syndromes in 2024. Market Intelligence adds the missing market view on top of that, so you can connect operational performance to where patients go and which facilities receive them.
National Offload Data Benchmarks
* Chart shows the amount of time within which 90% of offloads are completed by each acuity at time of arrival.
*Bars add up to more than 100% as some patients are admitted with multiple syndromes attached to their record
Why this data matters
ImageTrend is the state EMS data repository for 28 states and Washington, DC, with statewide ePCR records from participating agencies.
Market Intelligence leverages this data to provide visibility into patient flow, referral patterns, and prehospital context, supporting operational planning and market strategy.
The data below shows a snapshot of national 2024 EMS offload benchmarks and leading EMS transport syndromes.