


By Macall Leslie Salewon, MPH, Epidemiologist
Background
In the United States, traffic-related injuries involving pediatric pedestrians or pedal cyclists remain a serious public health issue. In 2023 alone, these incidents resulted in nearly 45,000 emergency department visits, and 16% of pediatric traffic fatalities were among children walking or biking.¹ ² ³
Because walking and cycling are vital to children’s independence, mobility, and health, understanding when, where, and how these injuries occur is critical to guiding EMS preparedness and community prevention efforts.
Key Findings
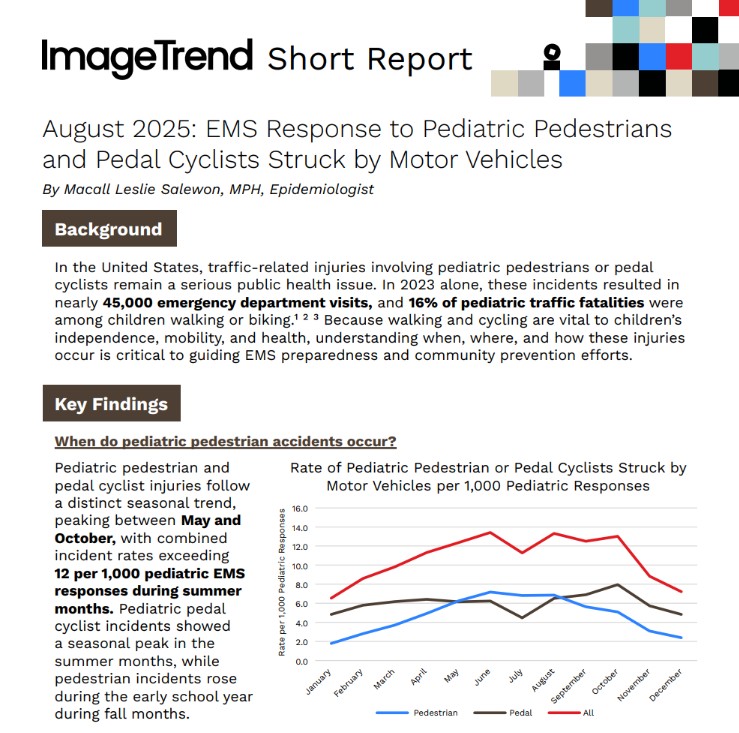
When Do These Incidents Happen?
Pediatric pedestrian and pedal cyclist injuries follow a distinct seasonal trend, peaking between May and October, with combined incident rates exceeding 12 per 1,000 pediatric EMS responses during summer months. Pediatric pedal cyclist incidents showed a seasonal peak in the summer months, while pedestrian incidents rose during the early school year during fall months.
In terms of timing, incidents cluster around school and work commute times and after school activities, especially between 3:00 PM and 9:00 PM, and are most frequent on weekdays—notably mornings on Tuesday and Thursday and afternoons on Thursday and Friday.
Patient Characteristics
- 68% of all patients were male
- Children aged 10–13 years old had the highest incident rates across both pedestrian (8.7) and pedal cyclist (9.0) categories
- 5–9 and 14–17 year-olds followed closely behind for pedestrian incidents
- Younger children (2–4 years old) had lower but still notable rates, especially as pedestrians
Where Are Incidents Occurring?
- Street locations were predominant for children 5 years and older, especially ages 10–17 years old, with over 70% of incidents occurring on streets
- Private residences were a more common location for incidents in children under age 5 than in older age groups
How Severe Are These Incidents?
- 11% of pedestrian and 5% of pedal cyclist incidents were classified as critical at initial EMS assessment
- 70% of pedestrian patients and 62% of cyclists were transported to a hospital
- A notable portion of patients declined transport against medical advice (AMA):
- 24% of pedestrian patients
- 16% of cyclists
Injury Patterns by Age
- Head injuries were most common in children under 5, with documentation in over one third of patients
- Lower extremity injuries were predominate in older children (14–17), while upper extremity injuries were more evenly distributed
Call to Action
To prepare for and help prevent pediatric traffic injuries, EMS agencies and community partners should:
1. Promote public education using age-specific pedestrian and cyclist safety resources from the National Highway Traffic Safety Administration.
- NHSTA general and age-specific resources for pedestrian safety
- NHSTA general and age-specific resources for cyclist safety
2. Incorporate pediatric trauma training into EMS continuing education.
3. Use time and location patterns to guide resource planning—such as placing crews in high-risk zones during school release hours or peak summer months.
4. Tailor response protocols to age-specific injury patterns, especially for managing head trauma in younger children and lower extremity trauma in older children.
About the Data
This analysis was conducted using the ImageTrend Collaborate™ dataset, a representative national EMS research resource4 consisting of de-identified data from agencies that opt into data-sharing. Pediatric pedestrian and cyclist incidents were identified based on 9-1-1 EMS activations using the eInjury.01 classification system.
Work With Us
ImageTrend’s Clinical & Research Services team partners with EMS and healthcare organizations to uncover actionable insights and drive data-informed public health initiatives.
Contact: ClinicalResearch@ImageTrend.com
Address: ImageTrend, Inc. | 1305 Corporate Center Dr, Eagan, MN 55121
Citations
1. Centers for Disease Control and Prevention (CDC). Web-based Injury Statistics Query and Reporting System (WISQARS) Fatal and Nonfatal Injury Reports: All Intents Pedestrian (traffic related) Nonfatal Emergency Department Visits and Rates per 100,000; Data Years: 2023, United States, <1 to 17, All Sexes, Disposition: All Cases. https://wisqars.cdc.gov/reports/?o=NFI&y1=2023&y2=2023&d=0&i=0&m=3042&g=00&me=&s=0&r=0&ry=2&e=0&a=custom&g1=0&g2=199&a1=0&a2=17&r1=INTENT&r2=NONE&r3=NONE&r4=NONE&adv=true. Accessed on 8/6/2025.
2. CDC. WISQARS Fatal and Nonfatal Injury Reports: All Intents Pedal cyclist (traffic related) Nonfatal Emergency Department Visits and Rates per 100,000; Data Years: 2023, United States, <1 to 17, All Sexes, Disposition: All Cases. https://wisqars.cdc.gov/reports/?o=NFI&y1=2023&y2=2023&d=0&i=0&m=3032&g=00&me=&s=0&r=0&ry=2&e=0&a=custom&g1=0&g2=199&a1=0&a2=17&r1=INTENT&r2=NONE&r3=NONE&r4=NONE&adv=true. Accessed on 8/6/2025.
3. National Highway Traffic Safety Administration. Fatality Analysis Reporting System (FARS): 2023 Annual Report File (ARF). Report Generated: Wednesday, August 6, 2025.
4. Ulintz AJ, Gage CB, Powell JR, Kamholz JC, Cash RE, Wang HE, Panchal AR. Evaluating ImageTrend Collaborate as a National EMS Dataset: A Cross-Sectional Comparison with the National EMS Information System. Prehosp Emerg Care. 2025 Jul 22:1-7. doi: 10.1080/10903127.2025.2526160. Epub ahead of print. PMID: 40623240.
Discover EMS Insights On Responses to Pediatric Pedestrians & Cyclists Struck By Motor Vehicles
Related Resources


Tomorrow Won’t Look Like Today. Prepare for What’s Next.
See the bigger picture and confidently face the challenges ahead with our industry-leading solutions.